 Co., Ltd.")
Layer Cracking Behavior of TiZrNbHf Refractory High-Entropy Alloys
Release time:
2025-09-30
Introduction
With technological advancement, the mechanical properties of traditional alloys under extreme conditions—such as high temperatures, high pressures, irradiation, and high strain rates—no longer meet the demands of modern societal development. Consequently, high-entropy alloys (HEAs), as an emerging class of multi-component alloys, have gradually garnered significant attention, becoming a cutting-edge research field. The concept was initially proposed by Yeh¹ and Cantor², typically referring to alloys composed of four or more elements in equimolar or near-equimolar ratios [2-4]. Due to their free composition and resulting diverse microstructures, HEAs often exhibit mechanical properties distinct from conventional alloys. In fact, the mechanical properties of most HEAs surpass those of conventional metals, particularly under extreme dynamic conditions such as high-speed impact and dynamic shear [5,6]. For instance, the representative Cantor alloy, FeCoNi-CrMn HEA, exhibits an ultimate tensile strength of 734 MPa and an elongation of approximately 63% during tensile testing at a strain rate of 2.3×10³ s⁻¹ [7]. At a strain rate of 10³ s⁻¹, the maximum yield strength can also reach 700 MPa [8]. Refractory high-entropy alloys such as TiZrNbV [9], TiZrHfNbTa [10,11], TiZrHfNbTaW [12], Al-Mo₀.₅NbTao₀.₅TiZr [13] and other refractory high-entropy alloys (RHEAs) all exhibit maximum yield strengths exceeding 1000 MPa at strain rates above 10³ s⁻¹. Energetic materials are substances capable of undergoing chemical reactions at high temperatures or pressures to release substantial energy [14-16]. Refractory high-entropy alloys containing easily oxidized metals like Ti and Zr hold significant potential as energetic structural materials. For instance, TiZrNbVRHEA⁹] undergoes intense combustion during high-speed impact, releasing large amounts of heat through oxidation reactions and exhibiting excellent impact energy release characteristics.
The phenomenon where cracks form internally when the tensile stress superimposed at the instant of intersection between two sparse waves moving toward each other within a material exceeds the material's tensile strength is termed layer cracking. The flat plate impact test serves as a crucial method for investigating layer cracking in materials. Studying the mechanical behavior of materials under extreme loading conditions provides a vital foundation for their future engineering applications. The dynamic mechanical properties of materials depend on both the loading strain rate and microstructural factors such as chemical ordering and lattice distortion. Through investigating dynamic layer cracking damage in Fe₅₀Mn₃₀Co₁₀Cr₁₀ high-entropy alloys, Wang Haimin et al. [17] observed that void nucleation sites were concentrated in the matrix region, with cracks tending to avoid high-impedance martensitic zones. Hawkins et al. [18] investigated the static and dynamic tensile responses of FeCrMnNi high-entropy alloys with varying Al contents. They observed that under static loading, the emergence of Al-Ni intermetallic compound clusters caused the material to transition gradually from plastic to brittle behavior. under identical loading conditions, the dynamic tensile strength correlates with the ferrite fraction near the austenite phase. A higher ferrite fraction increases nucleation sites within the matrix, allowing more efficient dissipation of internal energy during nucleation. This leads to an increase in the proportion of small voids while reducing the overall void fraction, ultimately enhancing the material's dynamic tensile strength. Zhang et al. [19] investigated the impact compression and layer cracking behavior of FCC-phase Alo.1CoCrFeNi HEA through flat-plate impact experiments. They observed a power-law relationship between layer cracking strength and loading strain rate, identifying dislocation slip and stacking faults as key deformation mechanisms. Nanotwins were also detected under high-speed impact loading. They concluded that damage in this HEA is ductile, with voids preferentially nucleating within grains and intragranular voids exhibiting strong dependence on grain boundary orientation difference and peak stress. Cheng et al. [20] studied CoCrFeNiHEA and found ductile damage, where impact-induced dislocation slip and deformation twinning dominate plastic deformation. With increasing impact velocity, dislocation density significantly increased, and twinning bundles began to form. During the early stage of layer cracking, voids preferentially nucleated at grain boundaries, particularly at triple junctions. Ren et al. [21] studied TiZrNbVRHEA and found its dynamic deformation governed by dislocation slip, dislocation diffusion, deformation band crossing, and grain refinement. Intergranular, transgranular, and mixed-type cracks dominated layer cracking failure. The dynamic Hall-Page effect and pinning effects induced by lattice distortion led to high dynamic yield strength. Their research indicates that the critical strain rate for the phonon drag effect correlates positively with the metal's relative atomic mass and local strain field. Within the experimental load range, RHEAs exhibit excellent structural stability, while theoretical calculations based on the state equation theory for cold energy mixtures accurately predict their impact response behavior. Valence electron concentration (VEC) directly influences the impact compression properties of HEAs; higher VEC values indicate greater difficulty in compressing the alloy.
Asymmetric flat-plate impact experiments were conducted using a 20mm Class I light gun platform to investigate the dynamic mechanical properties of TiZrNbHfRHEA. The layer separation strength, Hugoniot elastic limit, and Hugoniot equation of state within the experimental impact velocity range were obtained. Metallographic analysis of recovered specimens was performed to provide reference for the engineering application of TiZrNbHfRHEA.
1 Experiment
1.1 Material Preparation
The metal raw material particles for melting TiZrNbHf RHEA were Ti, Zr, Nb, and Hf particles with a purity ≥99.99%. Ti particles were procured from Hunan Xiangtou Jintian Titanium Metal Co., Ltd., Zr particles from Beijing Zhongjin Yan New Material Technology Co., Ltd., Nb particles from Changsha Nanfang Tantalum Niobium Co., Ltd., and Hf particles from Beijing Yanbang New Material Technology Co., Ltd.
In this experiment, the vacuum arc melting method was employed to prepare the initial ingots of TiZrNbHf RHEA. The equipment used was the DHL-1250 vacuum arc melting furnace developed by Shenyang Scientific Instrument Research Center.
The preparation process is as follows:
(1) Weigh Ti, Zr, Nb, and Hf metal particles in an equimolar ratio and perform ultrasonic cleaning to remove surface impurities;
(2) Thoroughly clean the copper crucible of the vacuum arc furnace, removing surface oxides to prevent impurities from entering the melting process; (3) Place the cleaned and dried metal particles into the copper crucible, initiate vacuum pumping, and introduce argon as the protective gas; (4) Apply power to initiate arc melting; (5) Repeatedly rotate the Ti ingot during melting to absorb residual oxygen within the furnace, preventing its entry into the melt; (6) Proceed with the formal melting of TiZrNbHf RHEA, repeatedly flipping the melt and employing a magnetic stirrer to thoroughly melt the granular raw materials and achieve complete mixing; (7) Transfer the resulting button-shaped ingot to a copper mold for melt-sucking casting.
The TiZrNbHf RHEA ingot obtained through the above steps is ultimately processed into a test specimen measuring Φ10mm × 2mm.
1.2 Material Structure Observation
Phase composition analysis was performed using X-ray diffraction (XRD). The X-ray source employed a CuKα tube with a wavelength λ of 0.1542 nm, operating at 40 kV and 40 mA. The scanning angle was 10°–130° at 20°, with a scanning speed of 3°/min. Scanning electron microscopy (SEM) was employed to examine the microstructure of the alloy. Electron backscatter diffraction (EBSD) was used to analyze grain distribution and size distribution in the alloy samples, with a scanning step size of 1 μm. EBSD samples were prepared using argon ion polishing. The cross-sectional morphology of the alloy was observed using both backscattered electron (BSE) and secondary electron (SE) imaging modes of the SEM.
1.3 Layer Cracking Test Apparatus
The layer cracking test was conducted on a 20mm Class I light gas gun platform. The test involved impacting an oxygen-free copper projectile against a TiZrNbHf refractory high-entropy alloy target plate. The flat plate impact test setup is assembled as shown in Figure 1.
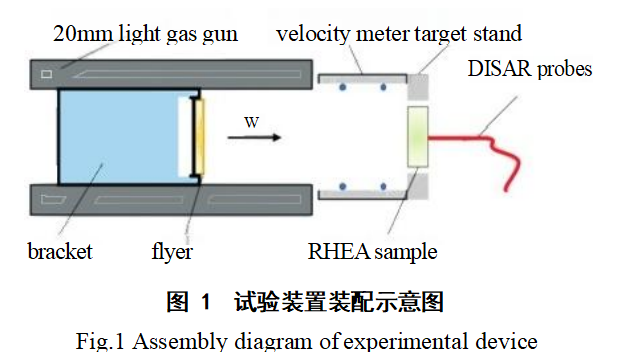
As depicted in Figure 1, oxygen-free copper with impedance similar to TiZrNbHf RHEA was selected as the projectile. Loading was achieved through the interaction between the polyetheretherketone (PEEK) spring and the projectile. Impact velocity was varied by adjusting the loading gas pressure in the primary gas gun chamber. Projectile velocity was measured using a magnetic anemometer at the gas gun outlet. The oxygen-free copper projectile dimensions are Φ12 mm × 1 mm, with a test velocity range of 360–740 m/s. The TiZrNbHf RHEA target plate is secured at the cannon muzzle via a polyetheretherketone (PEEK) target holder. During assembly, the target plate and projectile centerlines must align horizontally to ensure a head-on collision during impact. A fiber optic jumper is installed at the center of the target holder's backplate, with the other end connected to the Displacement Interferometer System for Any Reflector (DISAR). This captures the velocity variation curve on the specimen's rear (non-impact) surface, enabling analysis of internal layer fracture behavior. Note that the target plate surface requires sandpaper polishing. The non-impact surface measured by the fiber optic jumper must be polished to a mirror finish to ensure optimal laser signal transmission.
2. Computational Methods
2.1 Material Crack Propagation Calculation Method
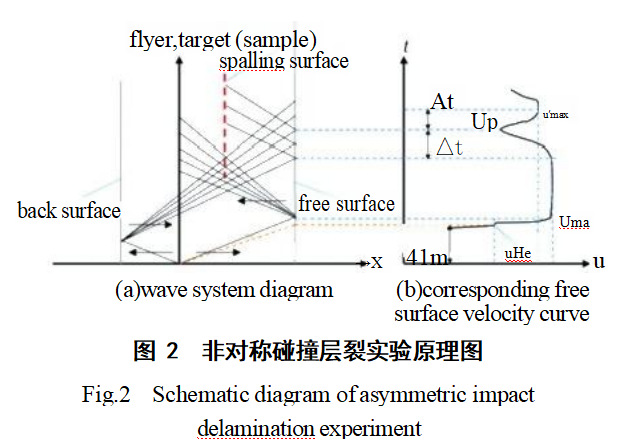
In asymmetric impact crack propagation tests, as shown in the wave diagram of Figure 2(a), the high-speed collision between the projectile and the target plate generates right-propagating and left-propagating shock waves in the target plate and projectile, respectively. Upon reaching the free surface of the target frame and the projectile, these shock waves undergo interface reflection, generating counter-propagating rarefaction waves and forming an interference region within the sample. The right-propagating wave reflects at the free surface of the target frame, causing the surface velocity to increase from 0 to Umax, as shown in Figure 2(b). The region of intersection formed by the counter-propagating rarefaction waves within the target frame constitutes the tensile zone. When tensile stress exceeds the material's tensile strength, cracks form within the specimen, causing delamination and creating new free surfaces. Simultaneously, the propagated right-propagating rarefaction wave reduces the velocity at the specimen's right-end free surface. Subsequent tensile waves are blocked by the cracks, and the reflected compression waves cause the free-surface velocity to rebound from up.
When oxygen-free copper chips impact the TiZrNbHf RHEA target plate, the target plate first reaches the Hugoniot elastic limit during the collision. The Hugoniot elastic limit is defined as the axial stress σHL at which the material undergoes elastic-plastic yielding under plane-impact loading. The Hugoniot elastic limit of the material can be calculated using the formula [22]: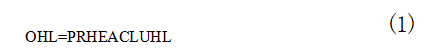
where: σHL is the Hugoniot elastic limit; PRE is the density of the TiZrNbHf RHEA; CL is the longitudinal wave velocity of the alloy under normal conditions, CL = 3841 m/s, measured at room temperature (298 K); UH is the particle velocity of the elastic wave; u is the maximum velocity of the leading elastic wave on the free surface, corresponding to the inflection point on the free surface velocity history curve, UH = 1/2 μu.
The strain rate εH of the initial elastic wave is given by: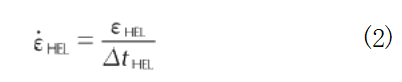
Where: HEL is the strain corresponding to point HEL;  △tHL is the time elapsed by the elastic compression wave.
The peak pressure Pmax of the impact loading can be calculated using the maximum free-surface velocity umax of the target plate and the material's equation of state. According to the free-surface velocity doubling law, the particle velocity behind the right-propagating shock wave is (Equation 2-2). Combining this with the shock wave relationship yields the peak pressure of the plastic wave impact, as shown below: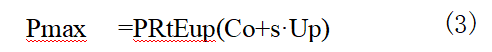
where: Pmax is the peak pressure of the plastic wave impact; Co and s are parameters of the TiZrN-bHf RHEA state equation.
Based on Romanchenko et al. [23,24]'s consideration of the influence of flake thickness on the flaking process, the flaking strength calculation formula is obtained as follows: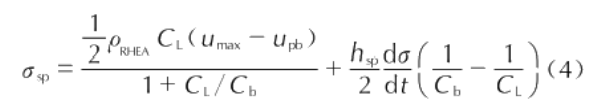
Where: hs is the flake thickness, mm; Umx is the maximum free-surface velocity, m/s; Um is the rebound velocity, m/s; Cb is the bulk wave velocity, m/s.
The stress rate  is calculated using the following formula:
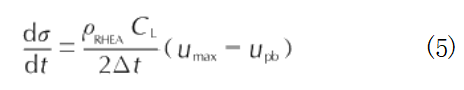
Where: △t is the time elapsed for the free-surface velocity to decrease from u_(max) to u, in μs.
The loading strain rate of the specimen during loading is given by [25]: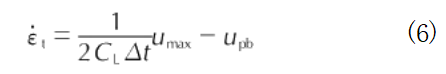
The specimen's re-acceleration a, defined as the rate of change of the specimen's free-surface velocity from the rebound velocity u to the peak velocity u'_(max) [25], is given by: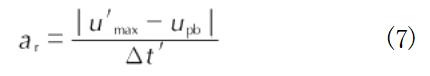
2.2 Theoretical Calculation Method Using Hugoniot Equation of State
Prior to experimental determination of material mechanical properties, the Hugoniot equation of state is employed to predict material characteristics. Theoretically calculated data are used to design specific dimensions of darts and specimens, and to select materials matching the impedance of target plate specimens [26]. In layer fracture experiments, Hugoniot data are typically utilized to estimate layer fracture strength [27-29]. This study employs the cold energy mixing method to predict the state equation for high-entropy alloys.
As established in solid-state physics, at low-to-medium pressures and neglecting the effects of electron thermal motion, the total pressure P+ in metallic crystals primarily comprises cold pressure Pc and thermal pressure PH, as expressed by:
where: specific volume V = 1/p, p is density; T is temperature.
Cold pressure Pc represents the pressure generated by compressing the metallic lattice at temperature OK, determined by interatomic interactions. Thermal pressure Pa represents the pressure generated by the thermal motion of atoms—their minute vibrations from equilibrium at non-zero temperatures—and is temperature-dependent. Using the material's cold energy-cold pressure (Ec-Pc) curve as reference, combined with the shock wave conservation relationship, the impact Hugoniot curve based on the Ec-Pc curve can be derived [303], as shown below: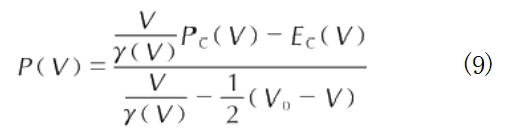
Where: Pc is cold pressure; Ec is cold energy (i.e., the material's pressure and internal energy at 0K); Vo = 1/p is the initial specific volume; P. is the initial density; 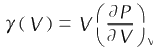 is the Grüneisen factor, which is a function of specific volume V.
Based on experimental results, the material's shock Hugoniot curve can be derived as a straight line, indicating a linear relationship between the shock wave velocity D and the particle velocity up at the free surface [22, see Equation 10]: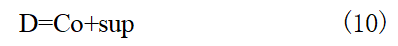
where Co and s are constants.
The impact Hugoniot curve based on the Hugoniot equation of state can be obtained via the formula [31, see below: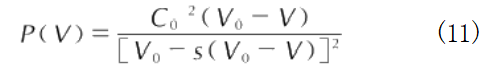
Equations (9) and (11) provide the impact Hugoniot curve derived from the shock wave conservation equation. Equation (9) represents the theoretical calculation method for the impact Hugoniot curve, while Equation (11) provides the expression for the impact Hugoniot curve based on experimental results.
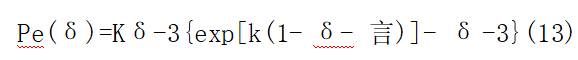
The Born-Meyer potential describes the cold pressure and cold energy in metallic crystals, as shown in Equations (12) and (13) [32]: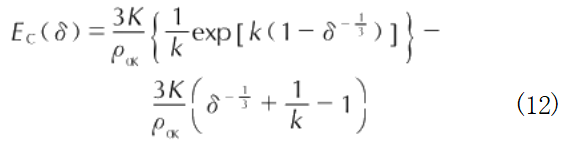
Equations (9) and (11) provide the shock Hugoniot curve derived from the shock wave conservation equations. Equation (9) represents the theoretical calculation method for the shock Hugoniot curve, while Equation (11) presents the expression for the shock Hugoniot curve based on experimental results.
The Born-Meyer potential describes the cold pressure and cold energy in metallic crystals, as shown in Equations (12) and (13) [32]: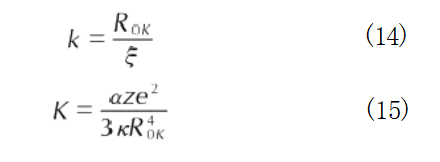
where: R is the atomic equilibrium distance at 0 K; ξ is the repulsive factor, dependent on the electronic structure of metal cations; a is the Madelung constant; e is the elementary charge; z is the valence electron number; k is the structure factor, dependent on the lattice structure; K and k are material parameters, comprehensively considering the internal structural characteristics of the crystal.
In the Einstein solid model, atomic vibrations within a solid can be regarded as one-dimensional harmonic oscillations with small amplitude about equilibrium positions. According to the Dugdale-MacDonald formula [34], the Gruneisen factor γ(V) can be described by the following equation: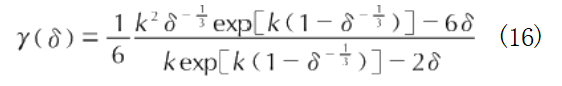
where K and k can be obtained from Hugoniot data at 0 K [35]: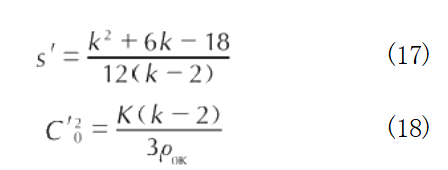
Typically, material parameters C and s are measured at room temperature, necessitating temperature correction of the measured values. The Hugoniot parameters C' and s' at 0 K can be calculated using the following equations [35]: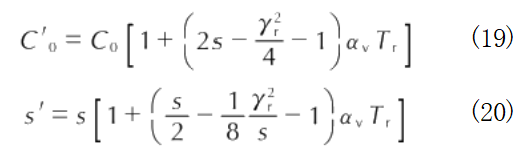
where: α is the volumetric expansion coefficient; y. is the Grüneisen factor at room temperature; T, is the room temperature.
If the pressures of all elements in the alloy reach equilibrium instantaneously during impact loading, the alloy's cold energy Ec can be calculated by superimposing mass-averaged properties [30], as shown below: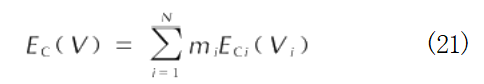
where: m, V;, Ec; represent the mass fraction, specific volume, and cold energy of the i-th element, respectively.
In theoretical calculations, TiZrNbHf RHEA is treated as a homogeneous alloy composed of Ti, Zr, Nb, and Hf. Based on the above formula and assumptions, the alloy's equation of state can be calculated through the following steps:
(1) Calculate the alloy's cold energy Ec using the cold energy-specific volume relationships and formulae for each element;
(2) Calculate the cold pressure Pc using the thermodynamic relationship Pc = -dEc/dV
calculate the alloy's cold pressure; (3) Using the cold energy-specific volume relationship and cold pressure-specific volume relationship data obtained from the above process, combined with Equations (9), (12), and (13), fit the material parameters K and k using the least squares method; (4) Calculate the Grüneisen factor γ(V) via Equation (16); (5) Finally, calculate the alloy's equation of state using Equation (11).
3 Results and Discussion
3.1 Microstructure of the Original Specimen
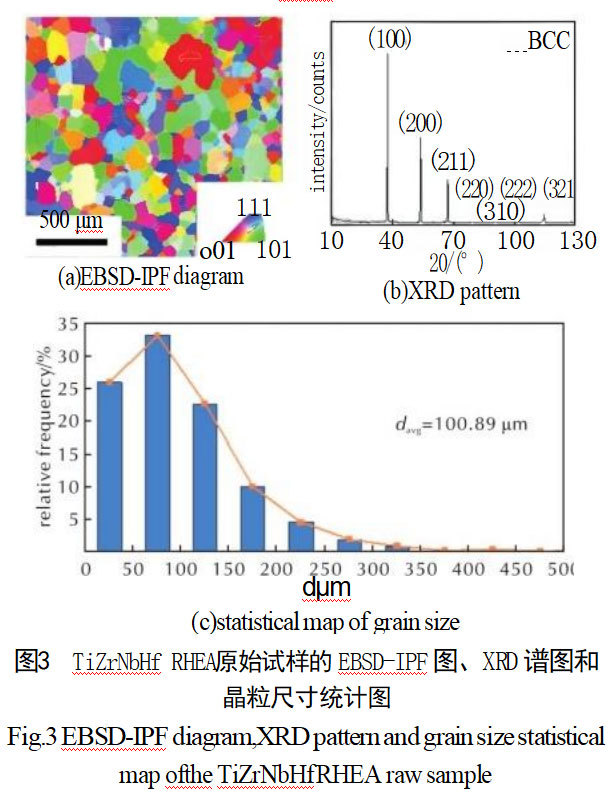
EBSD analysis of the original specimen revealed the following: Figure 3(a) shows the inverse pole figure (IPF), indicating uniform grain size distribution and random grain orientation within the specimen; Figure 3(b) shows the XRD pattern, confirming the alloy's single-phase BCC structure. Figure 3(c) displays the statistical distribution of grain sizes in the tested region, revealing a primary concentration between 25 and 125 μm. Statistical analysis yielded an average grain size of davg = 100.89 μm.
3.2 Analysis of Layer Cracking Behavior
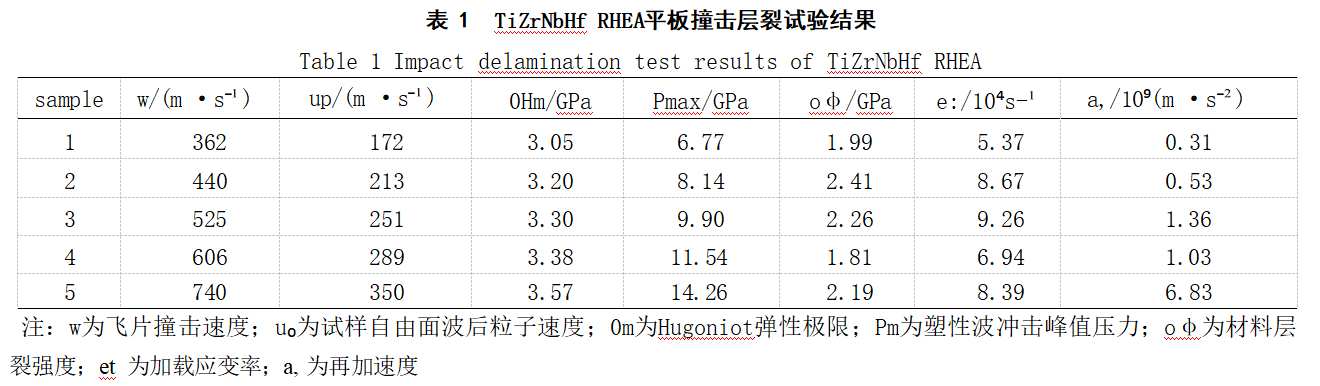
A total of five sets of flat plate impact layer cracking tests were conducted, varying the loading conditions by altering the impact velocity (w) of the flying fragments. The particle velocity on the free surface wave of the target plate (up) was calculated using formulas (1) to (7) to determine OHE, Pmax, Osp, et, and a. The experimental results are presented in Table 1.
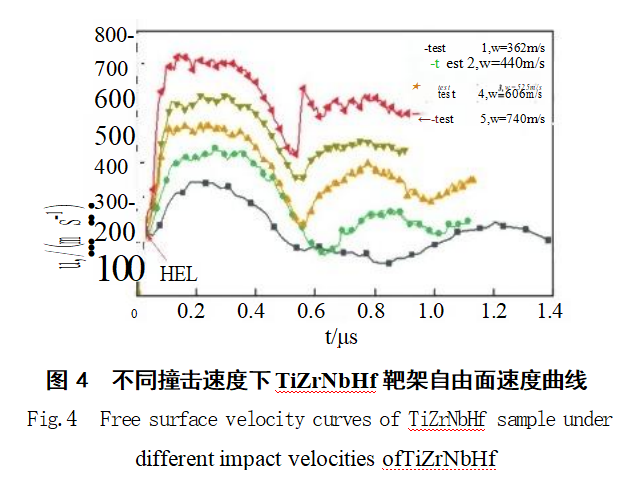
Table 1 indicates that the peak plastic wave impact pressure Pmax reached the Hugoniot elastic limit σHL, confirming delamination in the TiZrNbHfRHEA target plate. Figure 4 shows the free-surface velocity history curves for the TiZrNbHfRHEA target plate at different impact velocities. These curves align with theoretical predictions, confirming internal delamination. As the projectile velocity increased from 362 m/s to 740 m/s, the maximum free-surface velocity of the TiZrNbHfRHEA target frame gradually rose to approximately 700 m/s. Laminar cracking occurred within the specimen during loading. As the impact velocity increased, the peak impact pressure inside the target plate rose from 6.77 GPa to 14.26 GPa. The loading plateau width remained relatively consistent across different impact velocities, approximately 0.20 μs, as observed from the curves. Calculations show that the Hugoniot elastic limit oHa of TiZrNbHf RHEA increases with impact velocity, rising from 3.05 GPa to 3.57 GPa. Figure 4 also shows that as the impact velocity increases, the rebound velocity up occurs earlier, the time taken to rebound to the maximum velocity u'max becomes shorter, and the curve gradually steepens. This trend is consistent with the recalculated re-acceleration a. As the impact velocity gradually increases, a.max rises from 3.1×10⁸ m/s² to 6.83×10⁹ m/s².
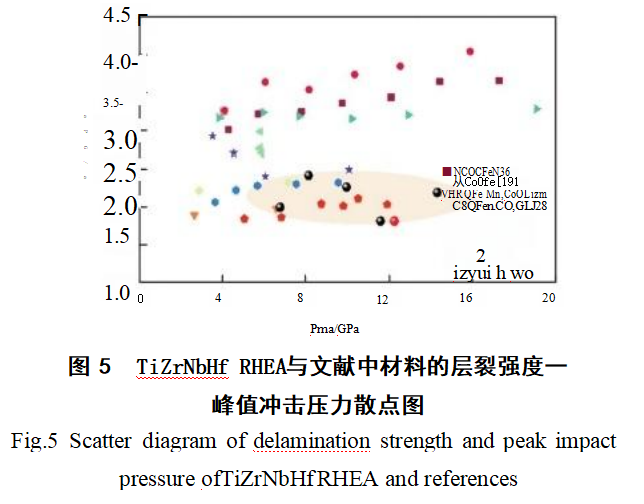
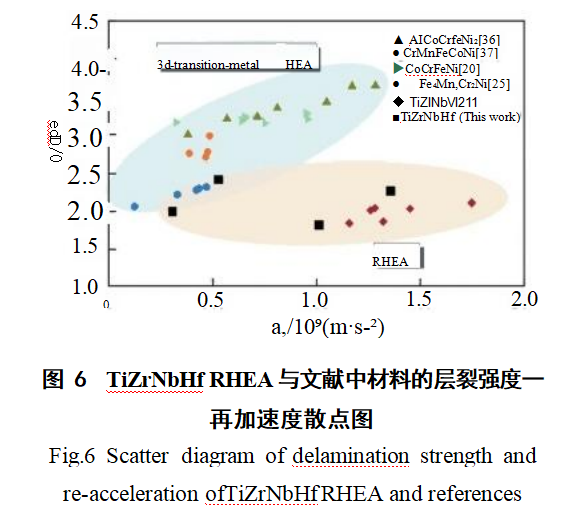
The layer splitting strength of the TiZrNbHf RHEA studied here is compared with that of Al-CoCrFeNi₂₀.₁[36], Alo₀.₁CoCrFeNi₁₉[28], HRQFesoMn₃₀Co₁₀Cr₁[28], CRQFe₅oMn₃oCo₁₀Cr₁₀[28], CrMnFeCoNi₃₇], CoCrFeNi [20], Fe₄OMn₂₀Cr₂O₂ [25], high-strength steel (HSSS) [38], and TiZrNbV²¹ as shown in Figure 5. The TiZrNbHf alloy in this study is a single-phase BCC structure refractory high-entropy alloy. Compared to Group 3D high-entropy alloys, its layer fracture strength is relatively low, ranging from 1.99 to 2.41 GPa, making it more susceptible to layer fracture phenomena.
The scatter plot of layer fracture strength versus re-acceleration for TiZrNbHf RHEA and materials from references [20,21,25,36,37] is shown in Figure 6.
Figure 6 further demonstrates that the layer fracture strength of refractory high-entropy alloys is generally lower than that of 3D family high-entropy alloys. The re-acceleration coefficient a reflects the damage rate during loading; a higher a indicates greater void nucleation and coalescence rates, as well as poorer ductility. Figure 6 shows that the scatter plot of layer fracture strength versus re-acceleration for TiZrNbHf RHEA is more dispersed than that of TiZrNbV21, with slightly higher layer fracture strength, indicating superior ductility compared to TiZrNbV RHEA. [²¹
3.3 Hugoniot Equation of State
The scatter plot of particle velocity at the free surface and plastic wave velocity from the layer fracture test is shown in Figure 7, exhibiting a linear Hugoniot relationship. The fitted relationship between shock wave velocity D and free surface particle velocity up is given by:
D = Co + sup = 4086 + 1.4562up (22)
In addition to deriving the TiZrNbHf equation of state from flat-plate impact experiments, its shock compression properties can also be calculated using the theoretical methods outlined in Section 2.2: First, the cold energy-specific volume relationship for each metallic element involved in the calculation is computed based on their respective parameters. The alloy's cold energy Ec is then determined via Equation (21). Subsequently, the thermodynamic relationship Pc = -dEc/dV is used to calculate the cold energy-specific volume relationship for cold compression. Finally, combining the data obtained from the cold energy-specific volume relationship and cold compression-specific volume relationship calculated through the aforementioned process with Equations (9), (12), and (13), the cold energy-specific volume relationship and cold compression dEc/dV to determine the alloy's cold compressibility Pc. Subsequently, using the cold energy-specific volume relationship and cold compressibility-specific volume relationship data obtained through this process, combined with equations (9), (12), and (13), the material parameters K and k are fitted using the least squares method. The Grüneisen factor γ(V) is then calculated via equation (16), and finally, the alloy's equation of state is derived using equation (11). For relevant parameters of each element during calculation, refer to Table 2 [33,39]. Using the above method, the theoretical values K=0.7881 GPa and k=6.0925 are obtained. Subsequently, the Gruneisen coefficient γ(V) is calculated, yielding the theoretical equation of state.
The spatial distribution of peak impact pressure relative to particle velocity and relative specific volume on the free surface is shown in Figure 8. Black dots represent experimental data, the red curve indicates the state equation fitted to experimental data, and the blue curve depicts the theoretical calculation curve based on the cold energy mixing method.
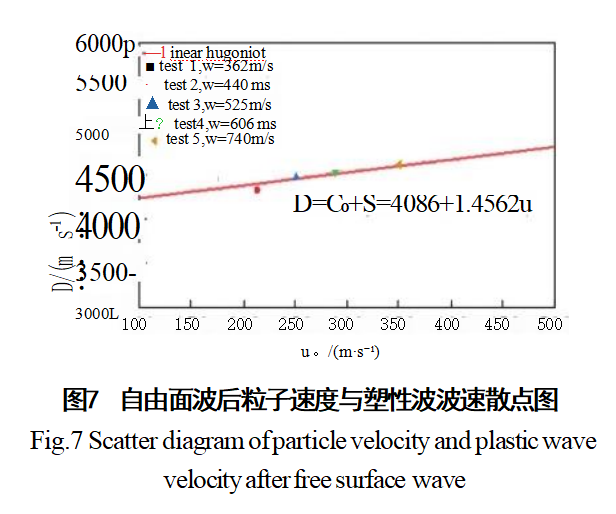
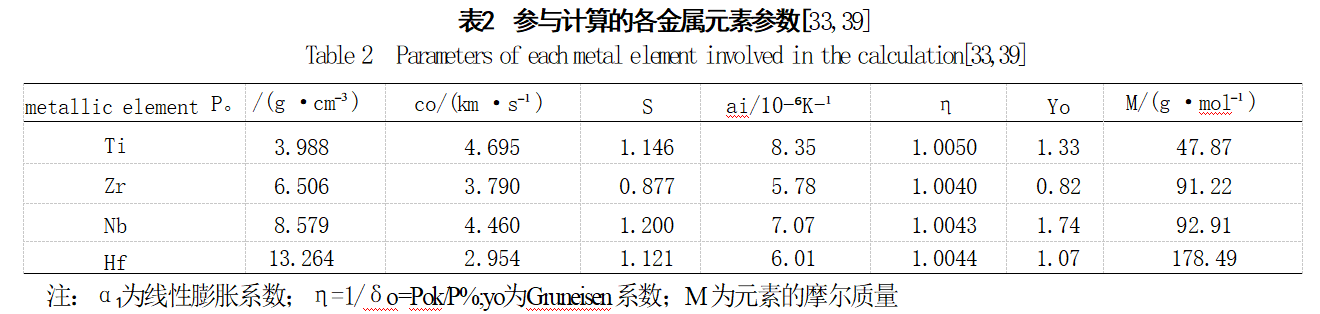
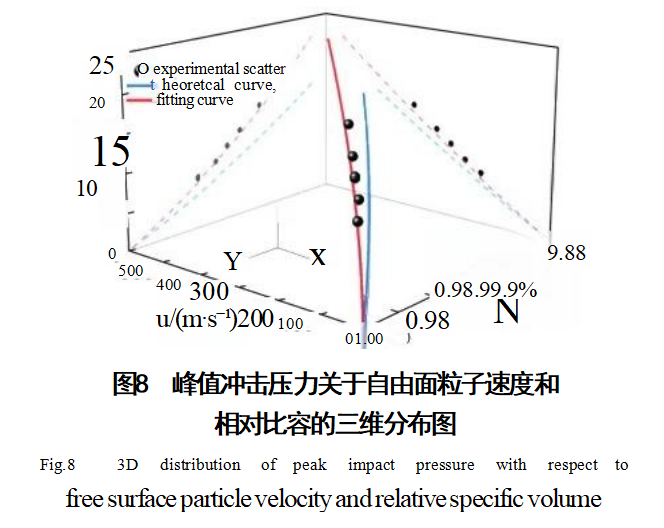
Figure 8 reveals discrepancies between the theoretical equation derived from the aforementioned process and the equation based on experimental data. Specifically, the experimental curve lies above the theoretical curve, with the error margin progressively increasing as the curve ascends. The theoretical method yields Co,mik=3660 m/s and Smx=1.1472, whereas experimental data provides parameters Co=4086 m/s and s=1.4562, indicating a deviation between experimental results and theoretical calculations. The theoretical method assumes uniform atomic distribution of constituent elements during mixing, no alteration of interatomic interaction potentials, and preservation of elemental properties. However, lattice distortion in HEA [4,40-44] causes changes in lattice parameters for TiZrNbHf RHEA, leading to variations in material parameters K and k. This results in experimental deviations from theoretical calculations [21]. Deviations exist between theoretical calculations and experimental results (fitted lines). However, when the particle velocity at the free surface is less than 250 m/s, the deviation between the theoretical and fitted lines in the peak shock pressure versus particle velocity curve is less than 20%. Similarly, for relative specific volumes exceeding 0.95, the deviation between the theoretical and fitted curves for peak impact pressure versus relative specific volume is also less than 20%. Therefore, it is concluded that this model can predict material properties at lower impact velocities.
3.4 Metallographic Analysis
Scanning electron microscopy (SEM) analysis was performed on recovered specimens from three impact velocities (440, 606, and 740 m/s). SEM and backscattered electron (BSE) results for specimens recovered at different impact velocities are shown in Figure 9.
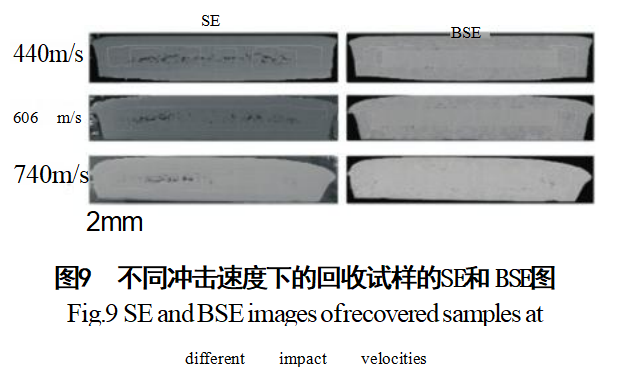
Figure 9 indicates that at 440 m/s, interconnected voids within the specimen begin to form layer cracks. As impact velocity increases, void diameters progressively enlarge. At 740 m/s, layer cracking is significantly more pronounced than at the 440 m/s operating condition.
A more detailed examination of the recovered specimen at 740 m/s reveals interconnected voids forming cracks, as shown in Figure 10.
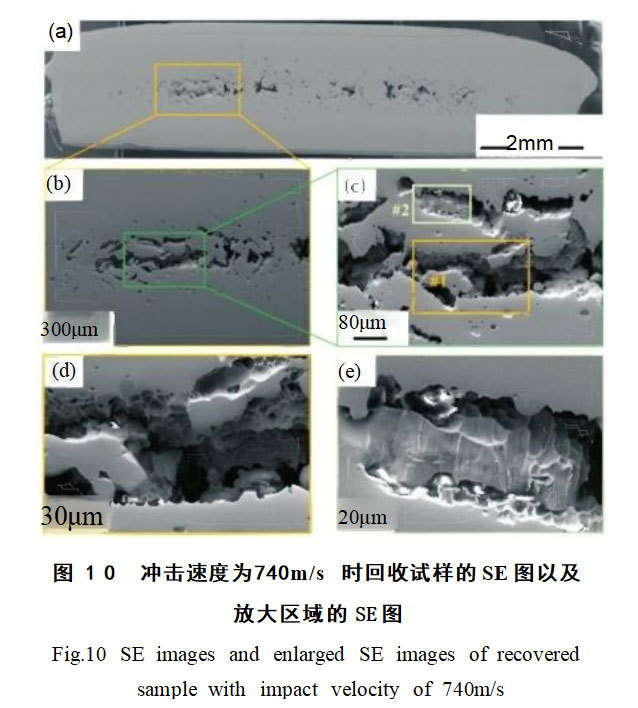
Magnified examination of severely damaged regions in this recovered specimen is shown in Figures 10(b) and (c). Figures 10(d) and (e) present enlarged views of regions 1 and 2, respectively, from Figure 10(c). Figure 10(c) reveals numerous ductile pits within the voids, as detailed in Figure 10(d), suggesting a ductile fracture mechanism. A small portion of river-like patterns was also observed in Figure 10(c), which is considered characteristic of brittle fracture. In summary, the damage mode of this material is a mixed fracture mode dominated by ductile fracture. Figures 10(d) and (e) reveal traces of melting within the cavities, likely caused by energy released during impact compression.
4 Conclusions
(1) Using flat-plate impact tests, the dynamic layer splitting characteristics of TiZrNbHf RHEA were investigated at different impact velocities. Within the plastic wave peak pressure range of 0–20 GPa, the layer splitting strength of TiZrNbHf RHEA ranged from 1.81 to 2.41 GPa.
(2) The Hugoniot equation for TiZrNbHf RHEA exhibits linear behavior, with the relationship between shock wave velocity D and free-surface particle velocity up given by D = Co + sup = 4086 + 1.4562up.
(3) Theoretical calculations of the state equation deviate from experimental results due to lattice distortion in RHEA. However, the theoretical method remains applicable for predicting material properties within the low-velocity range of the experiment (free-surface particle velocity below 250 m/s).
(4) Microstructural analysis of recovered specimens indicates a mixed fracture mode dominated by ductile fracture.
Reference: Chinese Library Classification: TJ55;O341 Document Type: A Article ID: 1007-7812(2024)12-1104-10
Layer Cracking Behavior of TiZrNbHf Refractory High-Entropy Alloy
Spherical TiZrNbHf refractory high-entropy alloy powder exhibits a body-centered cubic structure, featuring high strength (tensile strength exceeding 700 MPa), low elastic modulus (as low as approximately 70 GPa), and excellent ductility, with stable microstructure and properties at elevated temperatures. Its spherical morphology confers superior flowability and formability, making it suitable for processes such as additive manufacturing. Additionally, its constituent elements are non-toxic or low-toxicity, ensuring good biocompatibility. Compared to traditional alloys, it combines refractory properties with superior comprehensive mechanical performance. Suitable for biomedical implants, it also serves high-temperature component manufacturing in aerospace and other fields, offering practical value in 3D printing and powder metallurgy. For further details, please contact our specialist: Manager Cathie Zheng at +86 13318326187.

News
Stardust Technology (Guangdong) Co., Ltd.

101, Building 1, Liandong Youzhi Zone, Senshuji Road, Nansha Community, Danzao Town, Nanhai District, Foshan City,Guangdong Pro.,China
Tel:13318326187
13378621675
QR code