 Co., Ltd.")
Gold jewelry containing rhenium and tungsten detection methods
Release time:
2025-07-14
Gold has been the first choice of many consumers for investment because of its value preservation and fast cash. But in recent years, the international gold prices are rising, the domestic gold market retail prices are also rising. Unlawful businessmen to seek greater profit margins, the density and gold similar to rare heavy metals (such as iridium, rhenium and tungsten, etc.) mixed into gold jewelry. At present, the price of iridium soared, gold mixed with iridium has been unable to meet the demand for cost reduction, rhenium and tungsten gradually become a substitute for iridium. Rhenium (Rhenium) is a silver-white heavy metal, element symbol is Re, atomic number 75, density 21.04g/cm3, melting point of 3180 ℃. Tungsten (Tungsten) is a shiny silver-white metal, element symbol is W, atomic number is 74, density is 19.35g/cm3, melting point is 3410 ℃.
X-ray fluorescence spectrometry (XRF) [2] test the above rhenium and tungsten-doped gold samples, through the overlap of the characteristic spectral lines of the comparison [2], can qualitatively determine the anomalous characteristics of the peaks for the element rhenium and tungsten, but can not quantitatively analyze their content. Since the melting points of rhenium and tungsten are much higher than that of gold, and tungsten is insoluble in nitric acid, this means that it is difficult to accurately determine the gold content of this kind of gold jewelry when detected by the traditional fire assay method [3].
In this study, this kind of gold jewelry can be analyzed qualitatively and quantitatively by X-ray fluorescence spectrometry (XRF), metallurgical microscopy and inductively coupled plasma emission spectrometry (ICP-OES). Among them, ICP-OES method can accurately measure the content of rhenium and tungsten and other impurity elements, and then calculate the gold content in gold jewelry through the difference and subtraction, which is the preferred method for the quantitative analysis of such samples.
1 samples and the main test instruments and reagents
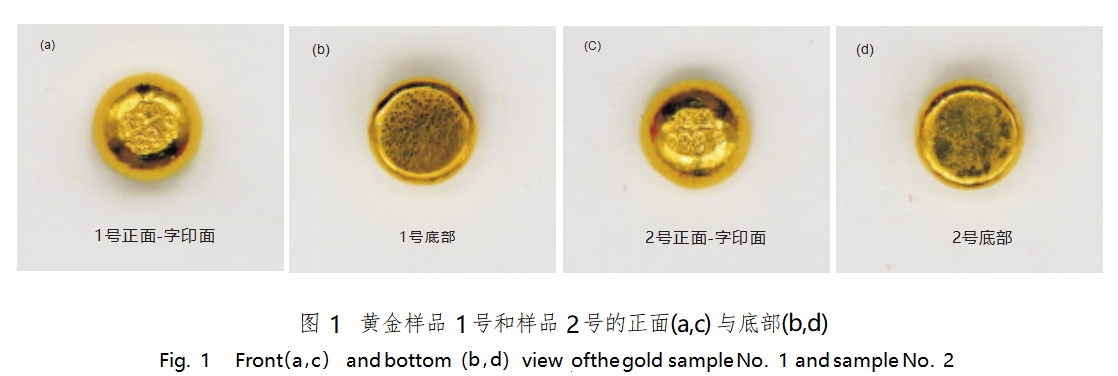
The test samples in this study are two pieces of gold products (stamped with 999.9 gold) for daily testing in the laboratory, with the weights of 1.01g and 1.00g, numbered No. 1 and No. 2 (Fig. 1), the appearance of the wordmarks are blurred, among which, the bottom of the sample No. 1 accompanied by a silver-gray speckles. With the consent of the client, the sample was further processed to determine its gold content.
The main test instruments include: Tianrui EDX3000PLUS X-ray fluorescence precious metal detector, resolution of 134eV, collimator 1mm, the measurement range of sulfur (S) ~ Uranium (U); Germany SPECTROBLUE Inductively Coupled Plasma Emission Spectrometer, the wavelength range of 167 ~ 78nm, the detection limit is better than 0.05mg / L, DDC detector, concentric DDC detector, concentric atomizer; analytical balance model METTLERTOLEDOXP6, precision 0.001mg; metallurgical microscope, the use of upper and lower light source, the maximum magnification of 1700 times.
Test reagents include: nitric acid, excellent pure, mass fraction of 65% ~ 68%; hydrochloric acid, excellent pure, mass fraction of 36% ~ 38%; aqua regia (hydrochloric acid and nitric acid volume ratio of 3:1), configured prior to the use of; hydrofluoric acid, No. 7664-39-3, C2, Xilong Science Co. NCS185013, produced by Steel Naktronic Testing Technology Co., Ltd; rhenium standard solution (500 μg/mL), No. NCS180024, produced by Steel Naktronic Testing Technology Co.
2 Results and analysis
2.1 X-ray fluorescence spectrometry
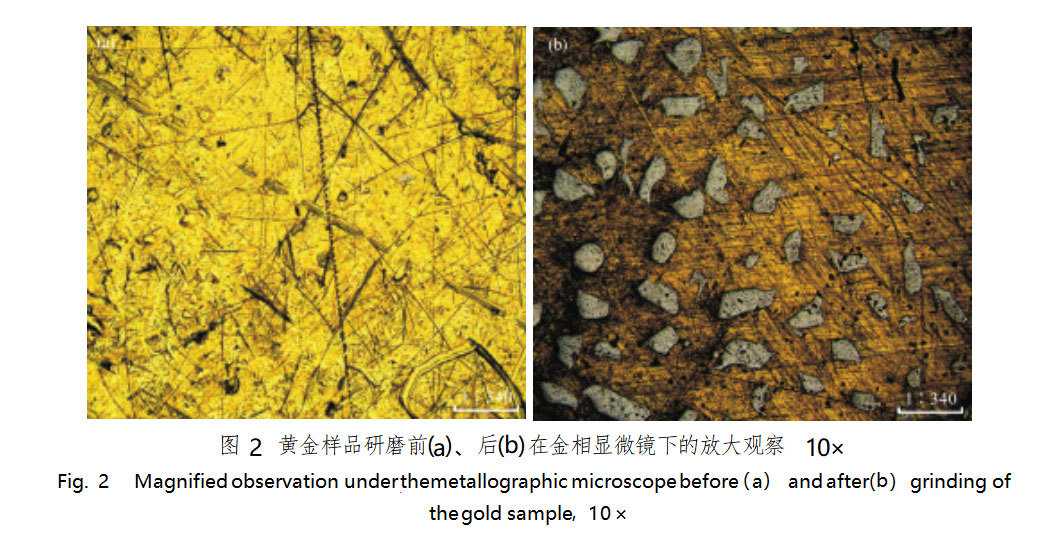
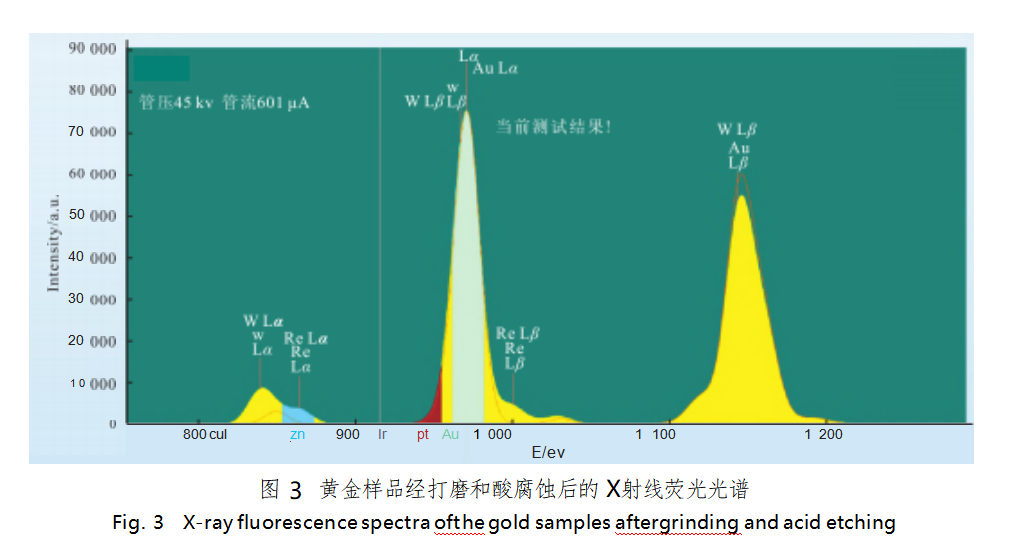
The surface of the sample was polished, and the dilute aqua regia was used to etch the surface of the sample [5], and then observed under the metallurgical microscope, a number of silvery-white spots could be seen (Figure 2). X-ray fluorescence precious metal detector was used to test two samples, the results and the national gold purity standard material GBW02751 (gold content of 999.94 ‰) X-ray fluorescence characteristics of the spectral line (Figure 3, red solid line) superimposed on each other, the results show that the tungsten L β peaks and gold L α peaks almost overlap with the L α peaks, but the tungsten L α peaks have a significant protruding, rhenium L α and L β peaks are present at the same time. The rhenium Lα and Lβ peaks are present at the same time. Thus, it can be determined that the two gold samples contain rhenium and tungsten.
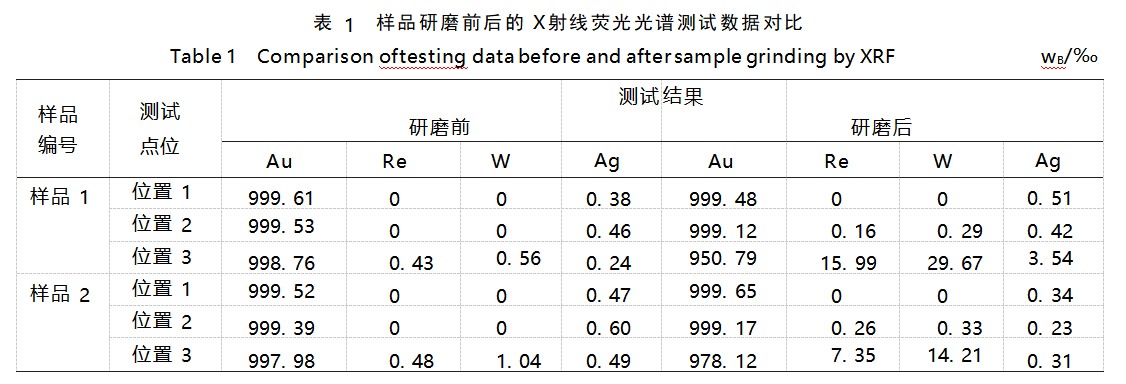
The current working curve does not add the elements rhenium and tungsten, and their characteristic peaks and the characteristic peaks of gold have a great degree of overlap, the laboratory according to the actual needs of the adjustment of the working curve, add the elements rhenium and tungsten, and simulate the intensity of the test. The samples were tested again and the results are shown in Table 1.
The results (Table 1) show that the dispersion of the data is large, indicating that the chemical composition of the samples is not uniform. Test position 3 is the bottom of the sample, and the large difference between the test results before and after grinding is mainly due to the fact that the density of elemental rhenium and tungsten is higher than that of gold, which produces the phenomenon of “bottoming out” during the processing.
2.2 ICP-OES method
2.2.1 Sample processing
Because the melting point of rhenium and tungsten is much higher than the melting point of gold, chemical stability, tungsten can not be absorbed by the ash dish in the fire-testing method, and it is insoluble in common acids other than hydrofluoric acid [5]. Therefore, fire assay is not suitable for the determination of gold content in this kind of samples. Therefore, the ICP-OES method was used to further determine the gold content of this sample. In order to ensure the uniformity and reasonableness of sampling, the samples were rolled into thin slices and cut into filaments before weighing.
2.2.2 Test Methods
Two samples of about 100mg were weighed separately, accurate to 0.01mg, placed in a 100mL polytetrafluoroethylene beaker, and 15mL of a mixture of 1 volume of nitric acid and 2 volumes of water was added, and heated slowly to dissolve the rhenium in the sample; after about 30mins, 15mL of aqua regia was added to continue the dissolution; after about 45mins, the solution became golden yellow, and a small amount of black particles had not yet been dissolved, which was then dissolved in the solution. At this time there is a small amount of black particles have not been dissolved, the black particles for elemental tungsten, and then add 2mL of hydrofluoric acid to the black particles completely dissolved; to be cooled down, the solution was transferred to a 50mL PTFE volumetric flask, and the volume was fixed with deionized water, and a blank test was done at the same time. If necessary, pipette 2mL solution into 50mL volumetric flask, and dilute 25 times to be tested and analyzed.
2.2.3 Standard curve
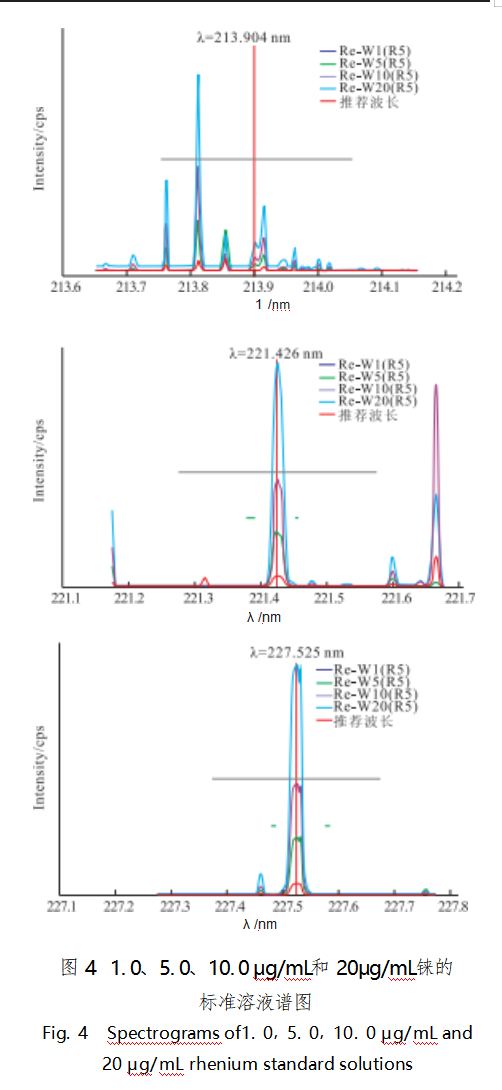
The standard solutions containing rhenium and tungsten were diluted step by step to different concentrations, so that their mass concentrations were 1.0, 5.0, 10.0 μg/mL and 20.0 μg/mL, respectively, and the working curves were established with the multielemental standard solutions with the mass concentrations of 0, 1.0, 5.0, 10.0, 20.0 μg/mL and 50.0 μg/mL, respectively.
2.2.4 Spiked recovery
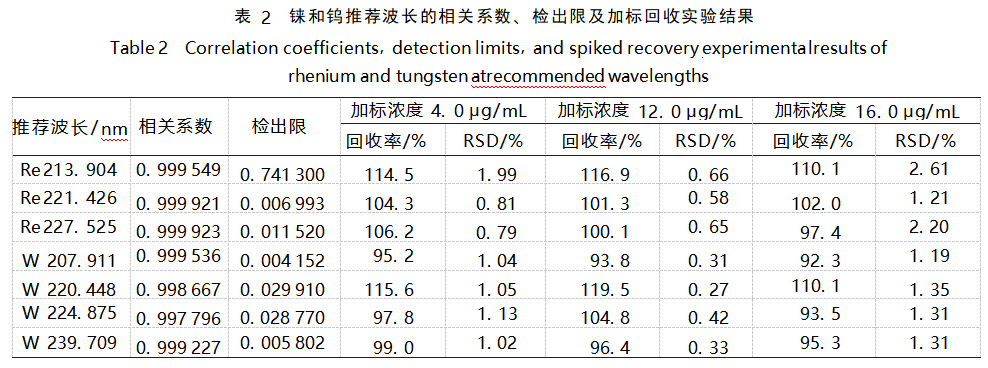
At present, the test standards such as GB/T40114-2021 [6], GB/T38145-2019 [7] all use ICP-OES method to determine the impurity elements in gold, and use the difference subtraction method to calculate the gold content in the analyzed samples. When using ICP-OES method to determine the content of metal elements, each element has multiple wavelengths to choose from, and usually the wavelength with high intensity and least interference is selected as the analytical spectrum [8]. Rhenium and tungsten are very common analytical elements, and there is no recommended wavelength for rhenium and tungsten in the test standard for reference. In this paper, SPECTROBLUE inductively coupled plasma emission spectrometer, rhenium recommended wavelengths of three: 213.904, 221.426nm and 227.525nm (Figure 4), of which, 221.426nm wavelength of high intensity and less interference. The recommended wavelengths for tungsten were 4: 207.911, 220.448, 224.875 nm and 239.709 nm (Fig. 5), among which, the wavelengths of 207.911 nm and 239.709 nm were of high intensity and less interference. In order to select the optimal wavelengths for testing and to verify the feasibility of the method and the accuracy of the test results, the spiked recovery method was adopted in this paper. The rhenium and tungsten standard solutions were added into 18 gold solutions with the mass concentrations of 4.0, 12.0 μg/mL and 16.0 μg/mL, respectively, and 6 spiked solutions were added into each group. The recoveries and relative standard deviations (RSDs) of the spiked samples are shown in Table 2.
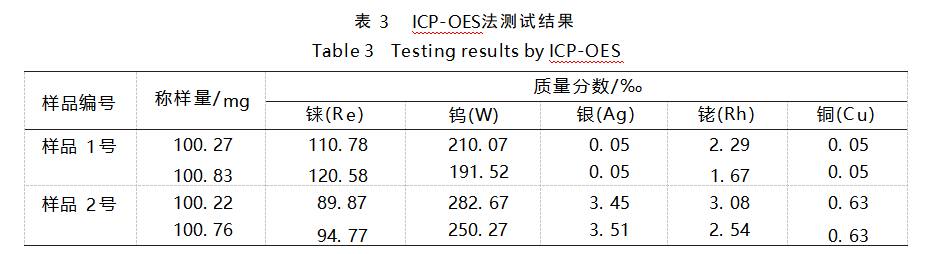
From the four aspects of interference between spectral lines, correlation coefficient, detection limit and spiked recovery, the spectral lines of rhenium and tungsten at 221.426 nm and 239.709 nm showed low interference and high intensity, and the recoveries were in the range of 95%~105%, with the relative standard deviations (RSDs) less than 2%. According to the optimal wavelengths of rhenium and tungsten, the results of the concentration of rhenium and tungsten in the sample solution are shown in Table 3.
Calculated by difference subtraction method, the gold content of these two pieces of gold jewelry are about 681.45‰ and 634.30‰ respectively, which are far lower than its mark “full gold 999.9”, belonging to malicious adulteration behavior.
3 Conclusions and recommendations
(1) Because the melting point of rhenium and tungsten is much higher than the melting point of gold, it often exists in gold jewelry in the form of irregular particles, and the distribution is not uniform, it can be observed through the magnification of the surface of the sample to see whether there is a silver-gray spots, and then select a number of representative positions for XRF method.
(2) When using X-ray fluorescence spectrometer for testing, rhenium and tungsten characteristic peaks and gold characteristic peaks are closer, and partially overlap, interfere with each other, easy to cause misjudgment. Therefore, we can compare and analyze the test line with the standard material line, observe whether there are abnormalities on both sides of the characteristic peaks of gold, so as to judge whether rhenium and tungsten are contained in the sample.
(3) ICP-OES method can accurately measure the content of rhenium and tungsten and other impurity elements in gold samples by choosing suitable analytical spectral lines, and then calculate the gold content by difference subtraction method. Because rhenium and tungsten exist in granular form and are not uniformly distributed, in order to ensure the uniformity and reasonableness of the sampling, the sample to be tested should be rolled and then cut into fine wire before sampling. Rhenium and tungsten were tested and analyzed at wavelengths of 221.426 nm and 239.709 nm, and the results were accurate and sensitive without interference from matrix and other impurity elements.The ICP-OES method is fast, simple, accurate and suitable as the first choice for analyzing gold jewelry containing rhenium and tungsten.
References:ICP-OES:TS93 Document ID:A Article ID:2096-9120(2025)02-0068-06
DOI:10.15964/j.cnki.027jgg.2025.02.009
Xu Yuewei et al: Detection of Gold Jewelry Containing Rhenium and Tungsten
Stardust Technology adopts RF Plasma Spheronization to Prepare Rare Metals Spherical powder, the powder has high sphericity, good fluidity and excellent powder performance. It can be used in 3D printing, surface spraying, powder metallurgy and other processes. If you have any demand for rare refractory metal powder, please contact our professional technician, Cathie Zheng +86 13318326187.
Stardust Technology (Guangdong) Co., Ltd.

101, Building 1, Liandong Youzhi Zone, Senshuji Road, Nansha Community, Danzao Town, Nanhai District, Foshan City,Guangdong Pro.,China
Tel:13318326187; 13318326185;
QR code